


[PRESS RELEASE] Anyone Can Now Perform Satellite Data Analysis Intuitively—SateAIs™ Releases New “Map Analysis” Feature
—Analyze vessels, oil slicks, buildings, and surface changes directly on your web browser simply by drawing on a map or talking to AI—
Space Shift is pleased to announce the September 25, 2026 launch of “Map Analysis,” a new feature for the web console of its satellite data analysis service, SateAIs™. This feature enables anyone to run AI-powered satellite data analyses through intuitive operations. Users can execute analyses in two ways: by specifying the target location directly on a map, or by submitting a request via chat to the built-in AI assistant. In either approach, analysis results are rendered directly on the map. This breakthrough eliminates the traditional need for programming or GIS software, allowing satellite data analysis to be performed entirely through a web browser.
■ Background: The Need for Specialized Knowledge in Satellite Data Analysis
Satellite data is gaining strong traction across diverse fields—such as maritime and ports, real estate, infrastructure management, and environmental monitoring—as a means to assess conditions over wide areas without visiting sites. In practice, however, searching, acquiring, and analyzing data has required specialized knowledge and tools, making it difficult for business professionals to handle directly on their own.
Following the release of the SateAIs™ API (Beta), Space Shift has progressively rolled out official Python and JavaScript/TypeScript SDKs, a command-line interface (CLI), Generative AI integration (MCP), and an official plugin for the GIS software QGIS, establishing an environment where developers and GIS practitioners can easily utilize satellite data analysis. This new feature expands access to satellite data analysis for business professionals who lack programming or GIS expertise.
- Access the SateAIs™ API Official Documentation here
- Read the press release on the launch of the Official SDK and CLI here
- Read the press release on Generative AI (MCP) and BI Tool Integration here <Japanese Only>
■ Overview of the New Feature
The new feature allows users to run satellite data analyses through two methods: “Specifying an Area on the Map” and “Requesting via AI Assistant.”
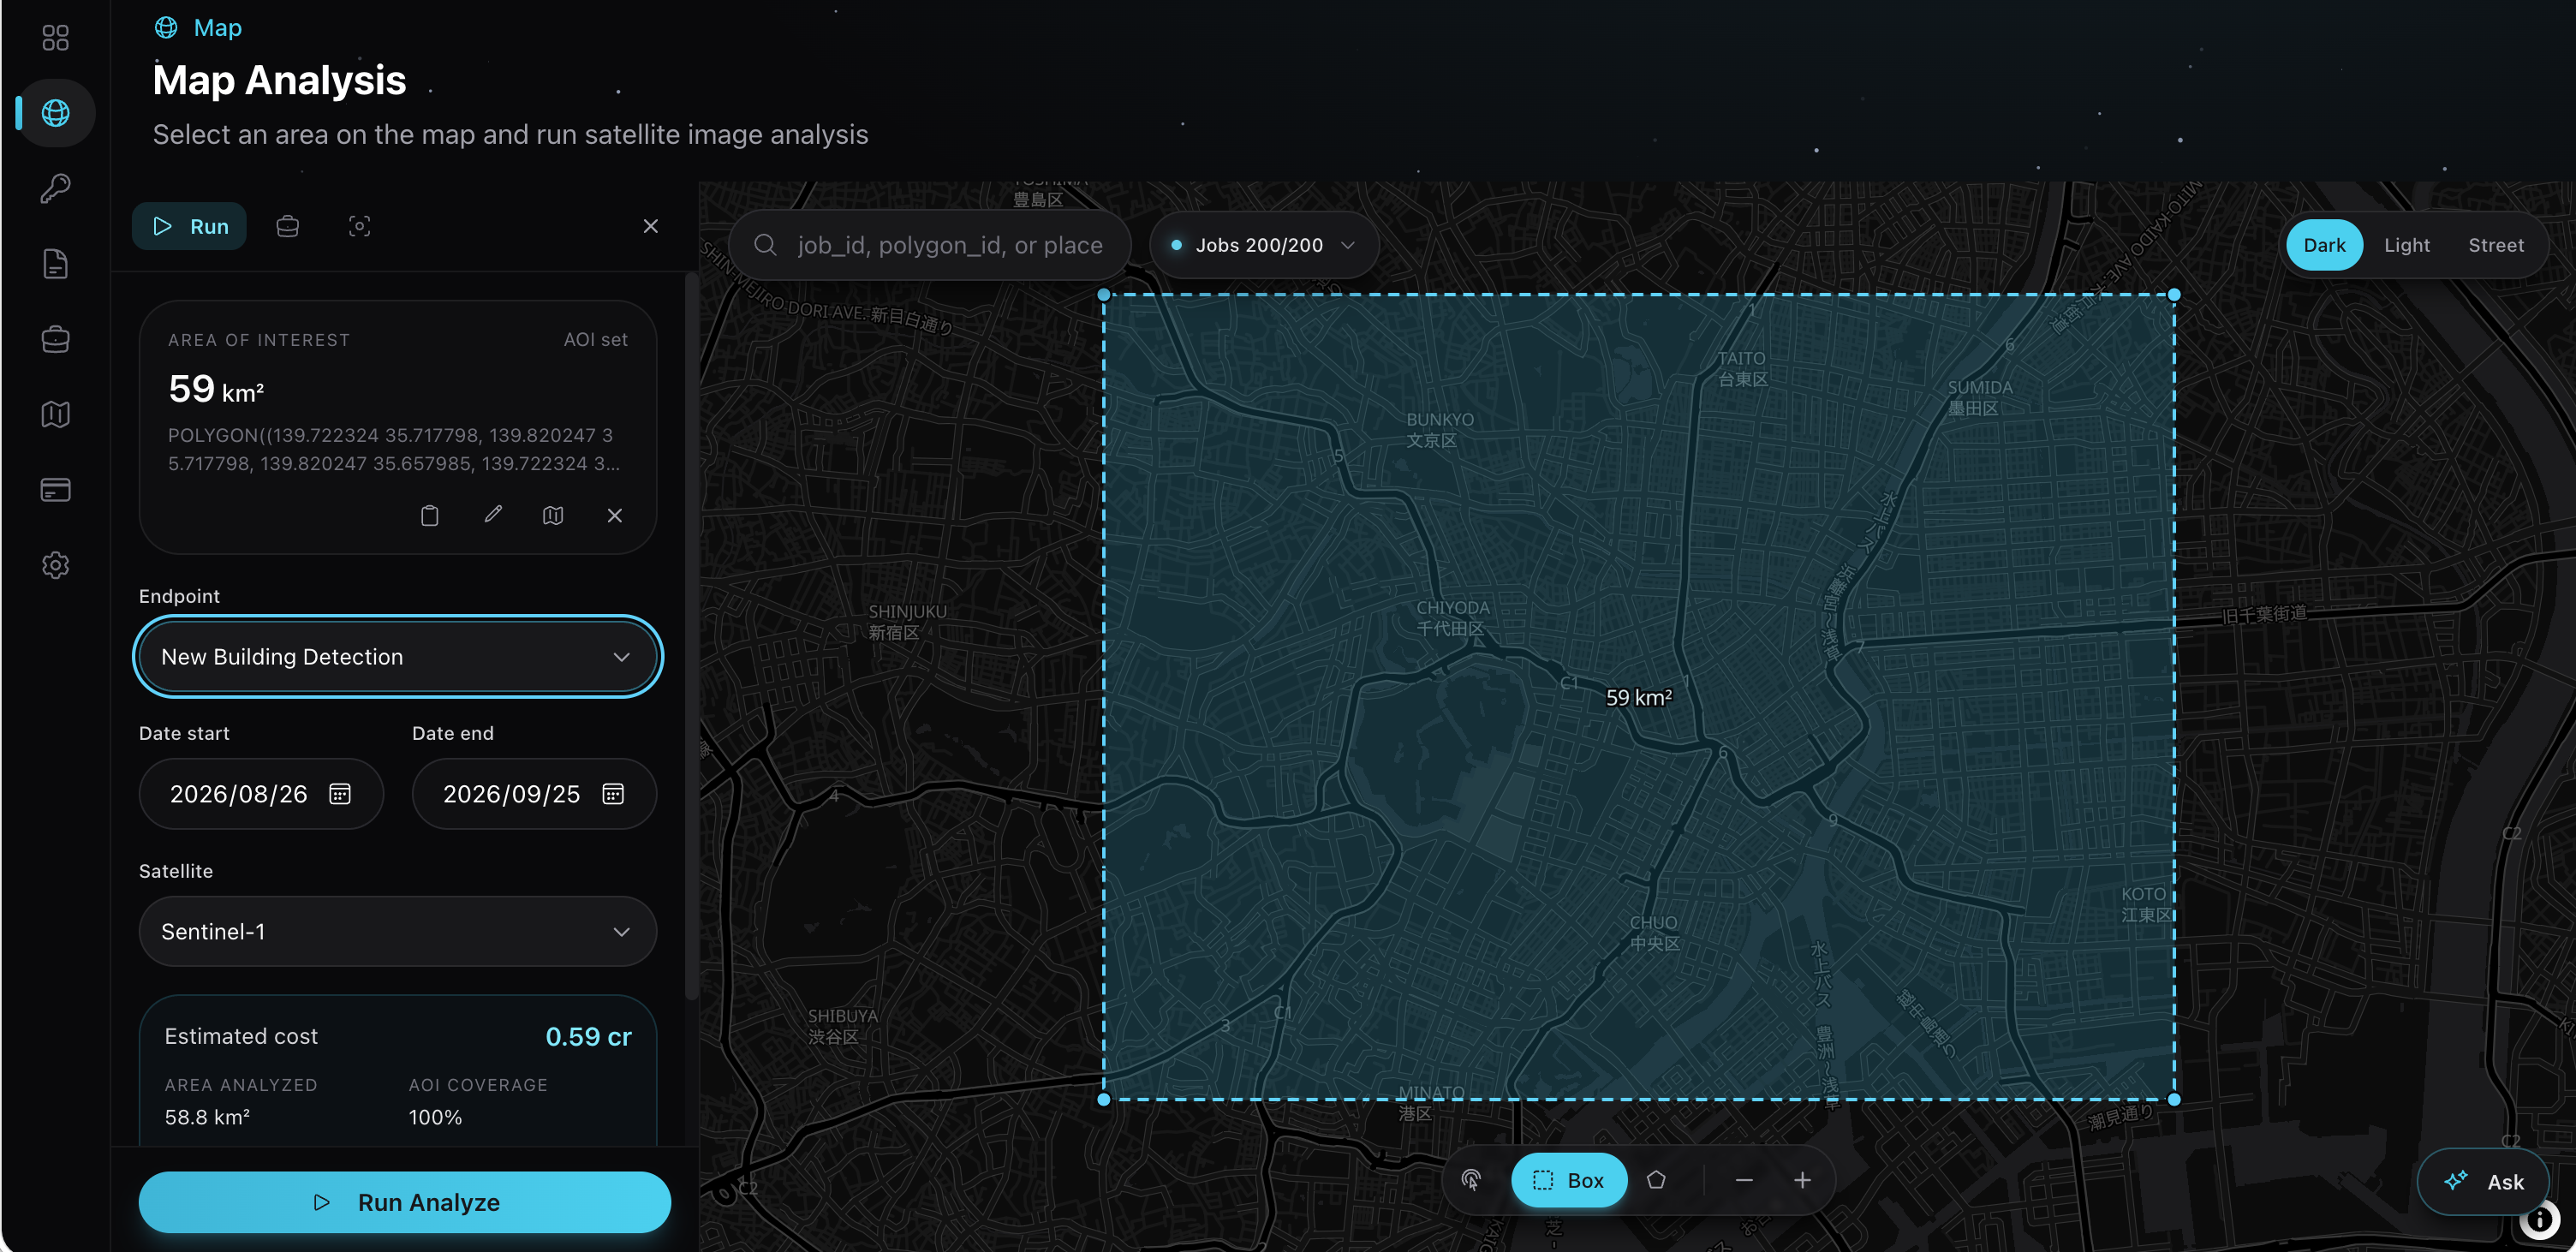
1. Analysis Simply by Specifying an Area on the Map
Search for a location by place name and enclose the area of interest using a rectangle or custom polygon. Select the analysis type and date range, then run the process to display results directly on the map. No specialized knowledge of satellite data files or coordinate systems is required.
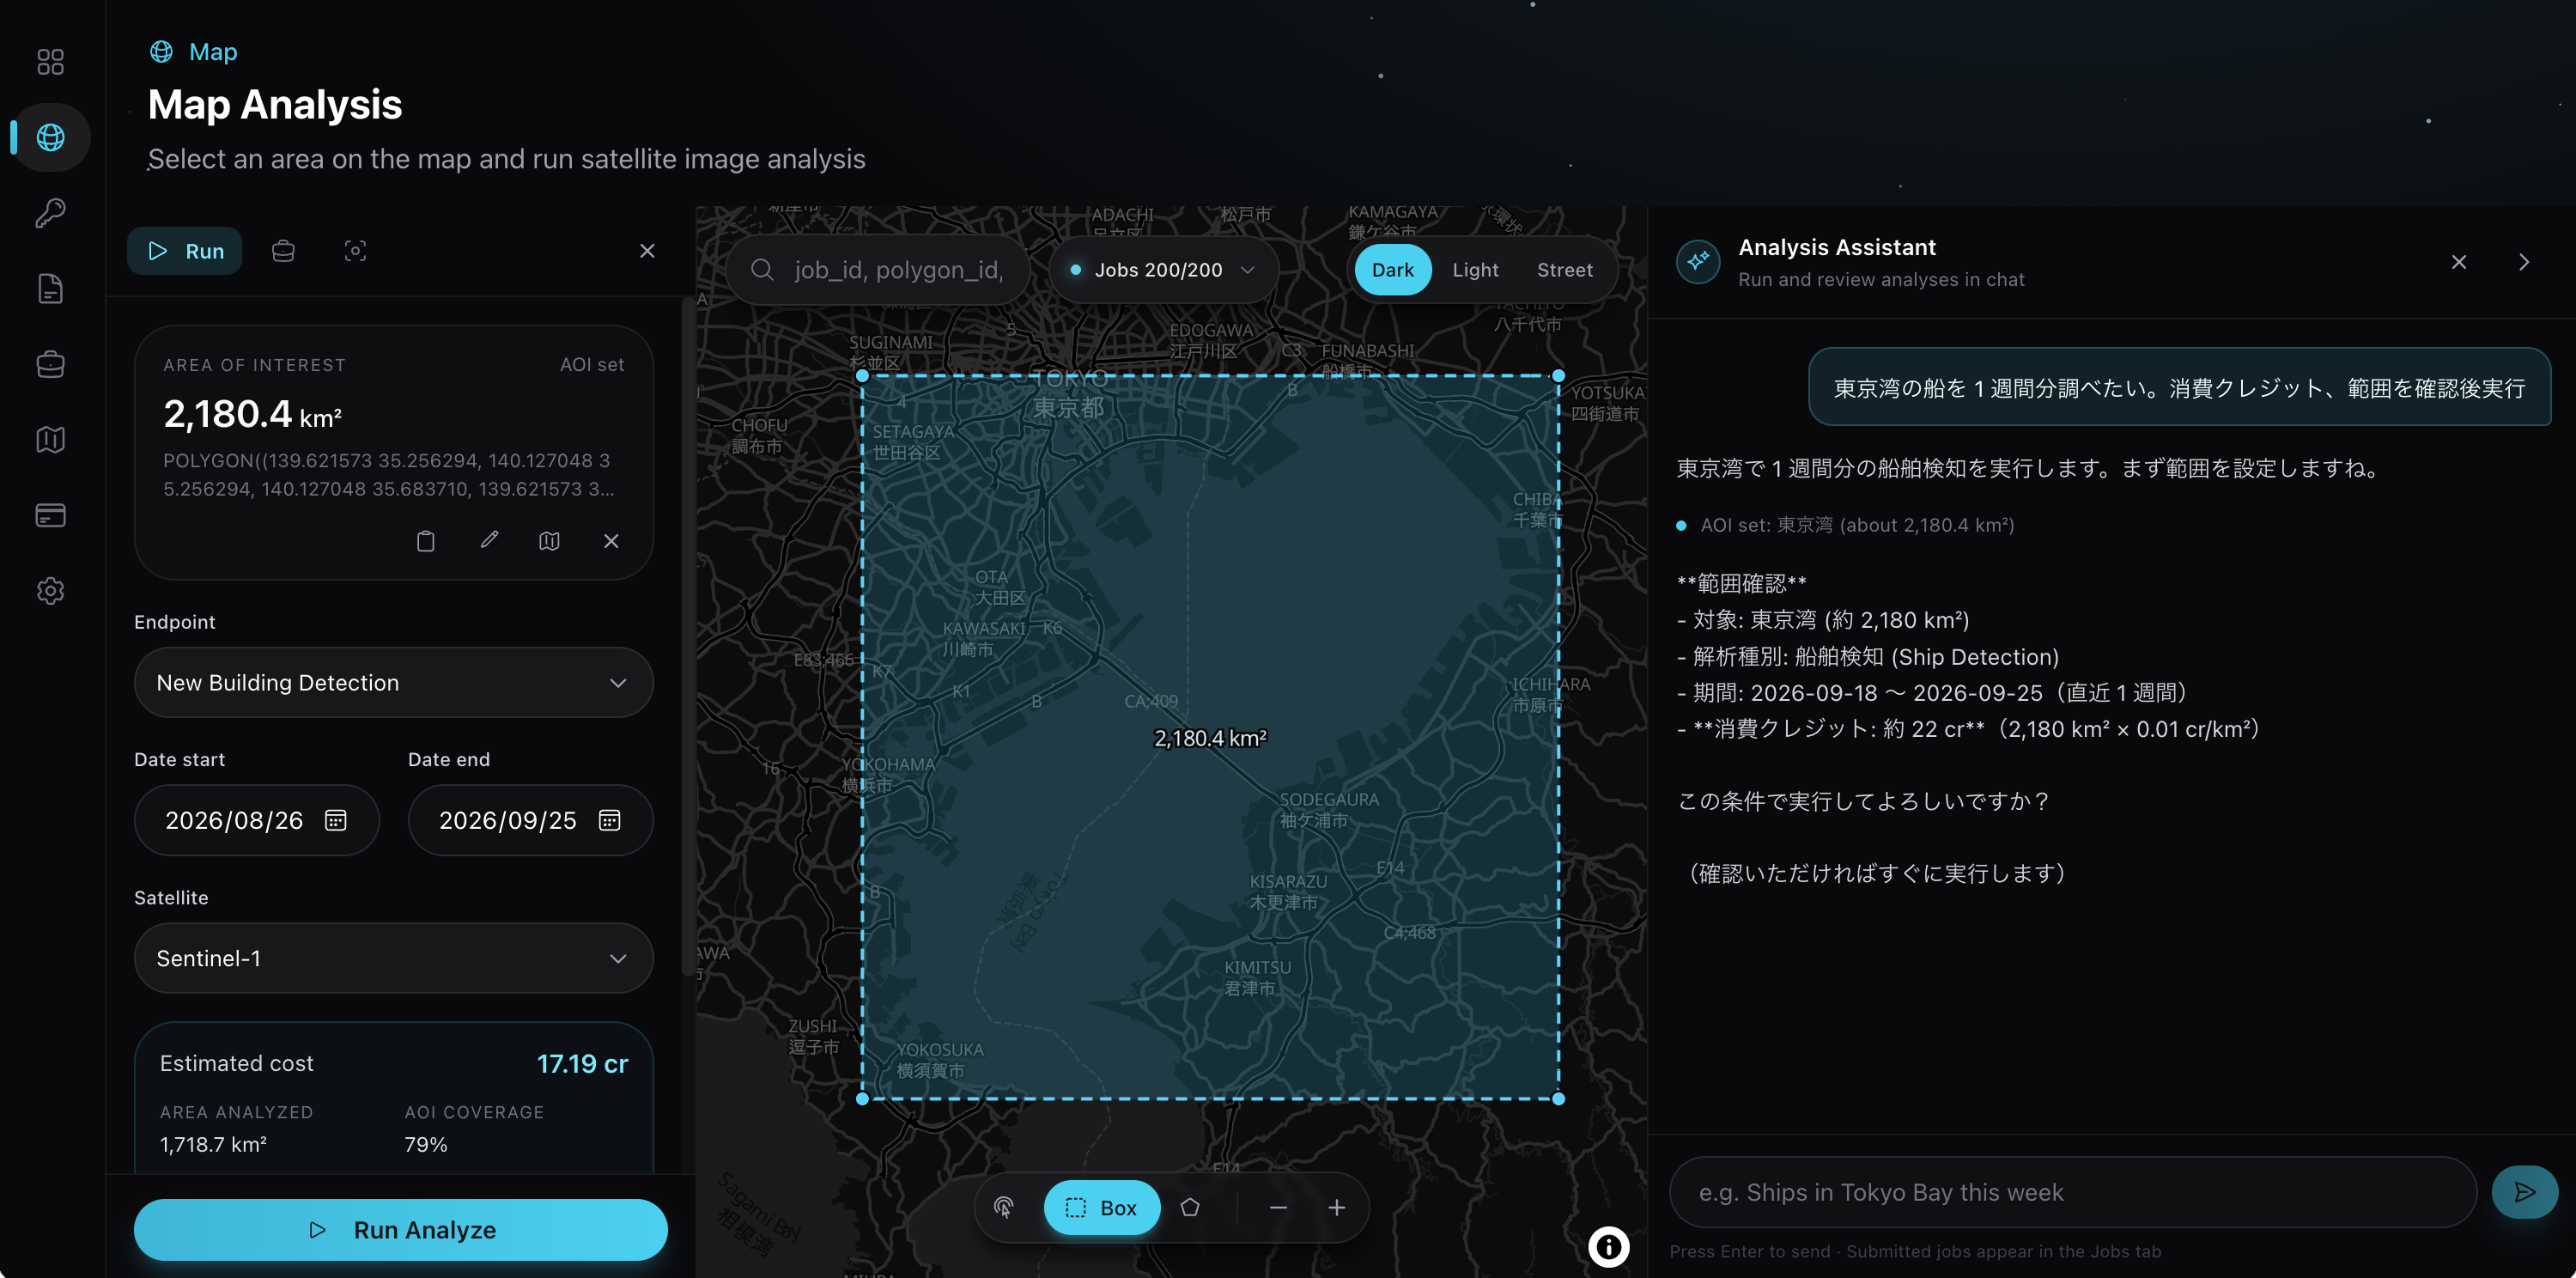
2. Analysis Simply by Messaging the AI Assistant via Chat
Type a request into the on-screen chat, such as “Analyze vessel activity in Tokyo Bay over the past week.” The AI assistant will propose the appropriate analysis area and conditions. Once you review and approve the details, the analysis runs automatically. You can also monitor analysis progress directly through the chat interface.
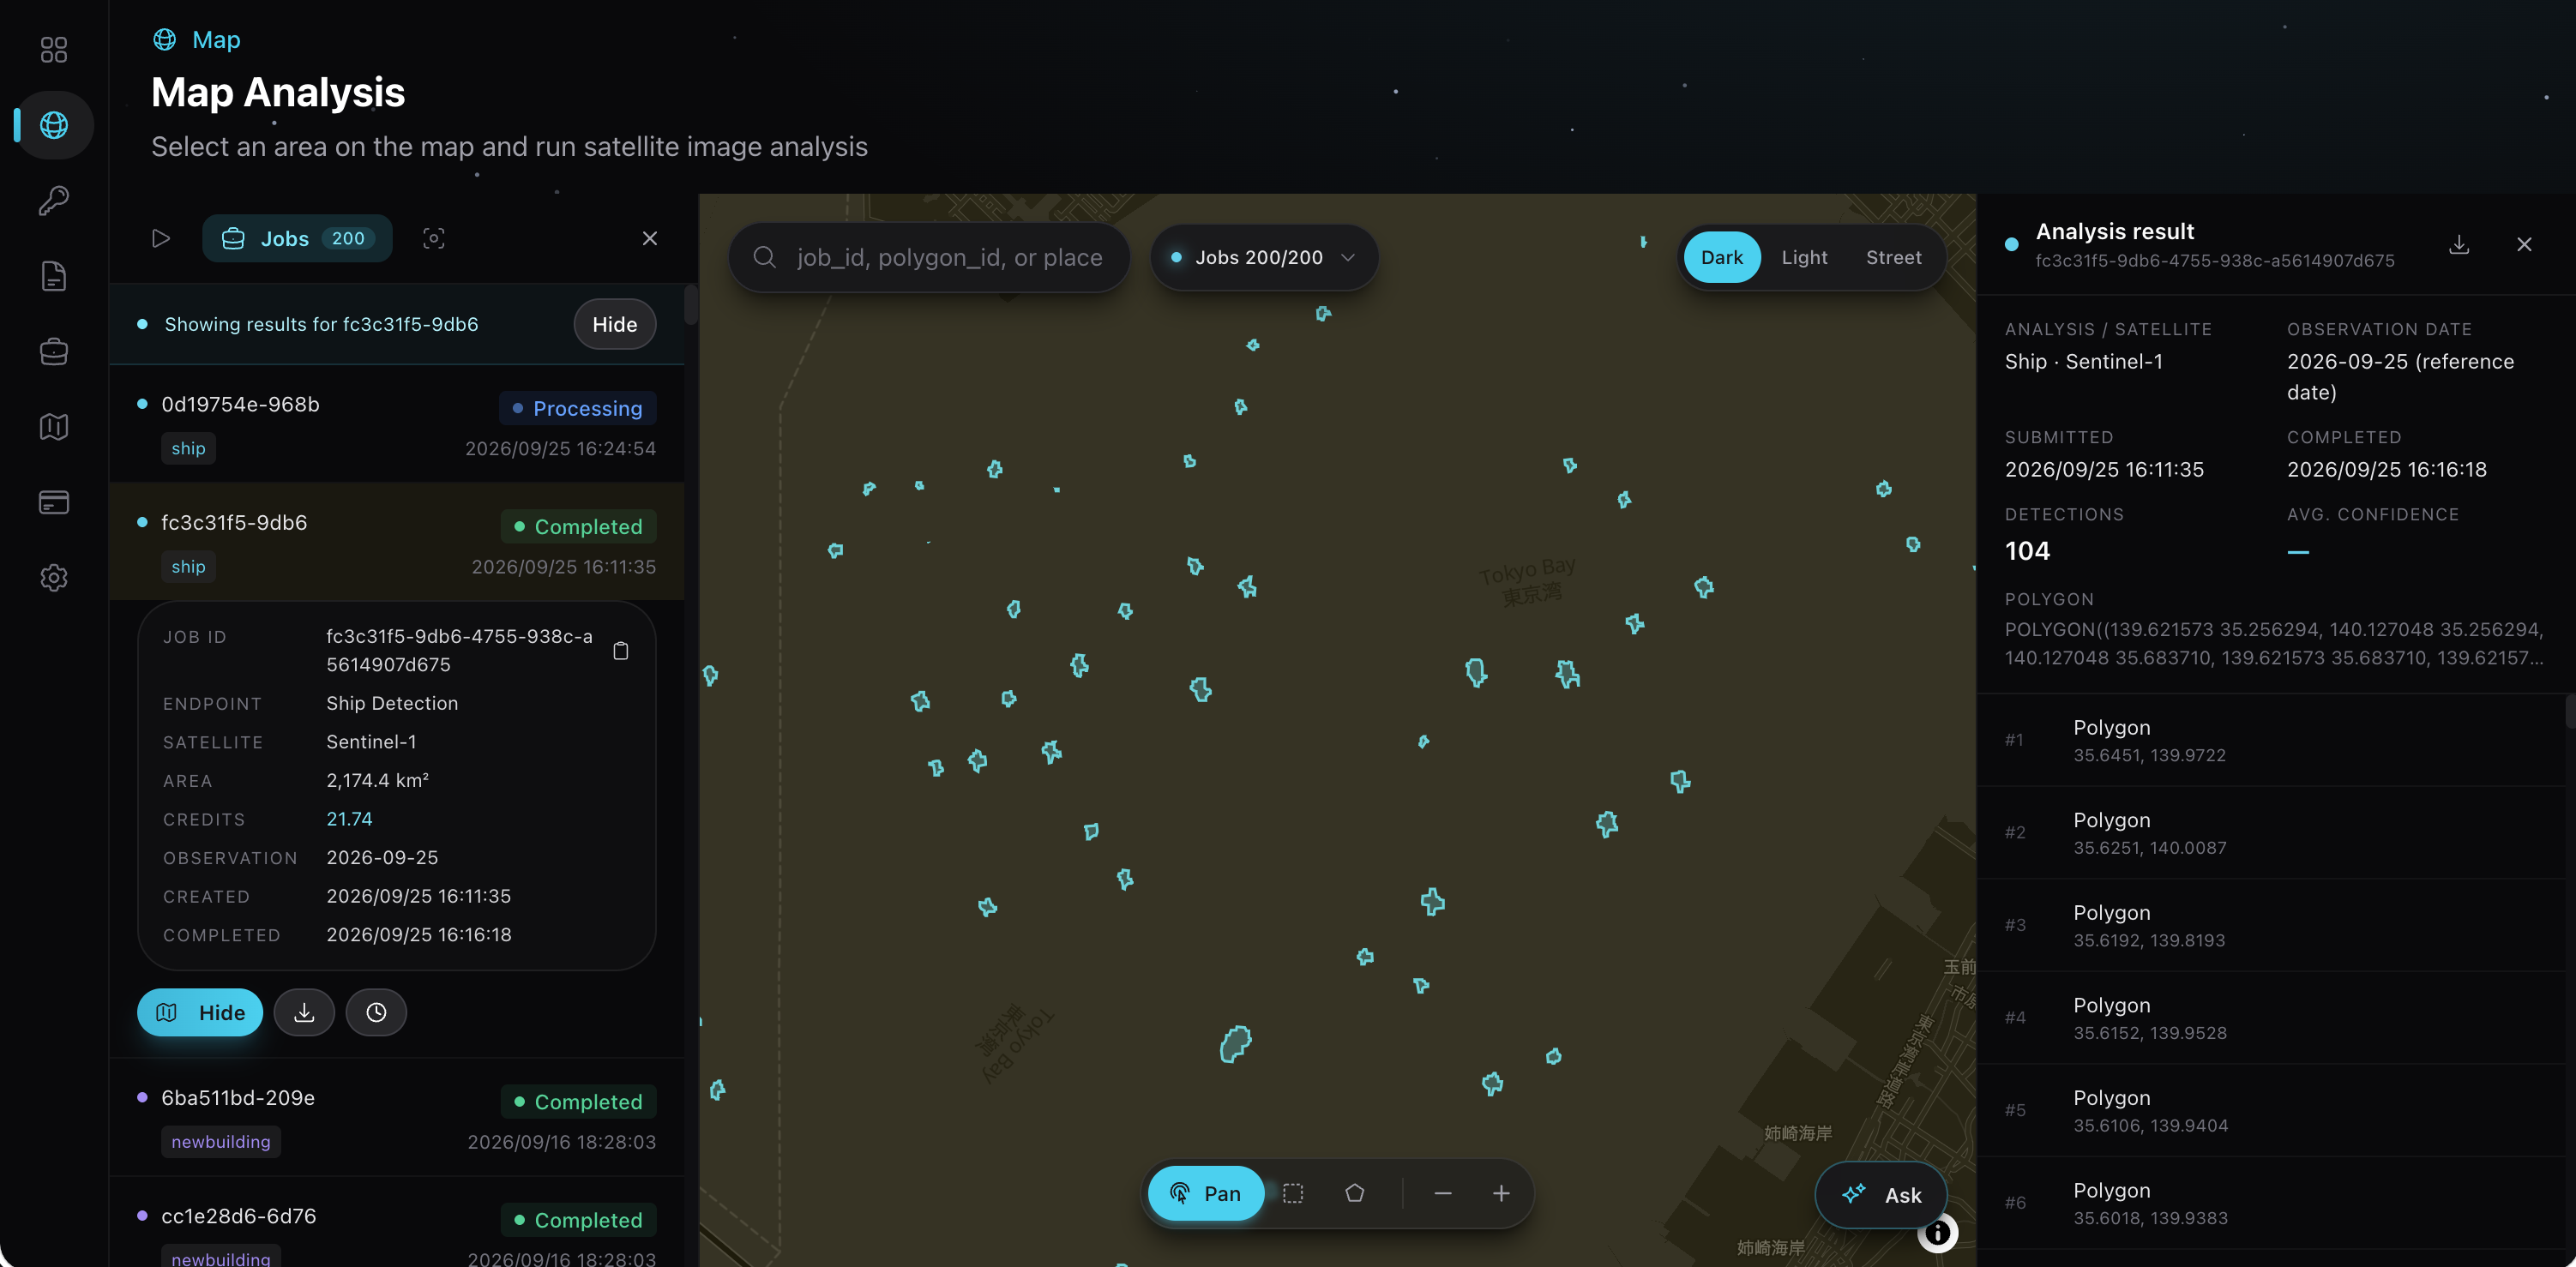
3. Immediate Results Verification on the Map
Analyses executed through either method are managed in a list. Selecting an item instantly navigates the map to that location, displaying the results visually.
■ Available Analysis Types
As of September 29, 2026, the following five types of analysis are available:
Table 1: Available Analyses and Expected Use Cases with the New Feature
| Analysis Type | What Can Be Identified | Expected Use Cases |
|---|---|---|
| Vessel Detection | Locations and count of vessels in a specified sea area | Assessing port congestion, maritime monitoring |
| Oil Slick Detection | Extent of oil spread across the sea surface | Early detection of marine pollution, environmental monitoring |
| New Building Detection | Newly constructed buildings within a specified period | Monitoring development trends, real estate, and urban planning |
| Demolished Building Detection | Buildings removed within a specified period | Tracking demolition status, fixed asset management |
| Time-Series Change Detection | How a specific location has changed over time | Monitoring construction progress and changes around infrastructure |
Analyses utilize data from Sentinel-1, an Earth observation satellite operated by the European Space Agency (ESA). Because Sentinel-1 uses SAR (Synthetic Aperture Radar) technology to observe the Earth’s surface via radio waves, it is unaffected by cloud cover or nighttime darkness. Observation frequency and capture dates are determined by satellite operational conditions.
■ How to Use
By registering an account on the SateAIs™ Console, users can utilize the new feature using 500 complimentary credits granted upon registration. Credits are consumed based on the analyzed area. Because the required credit amount is displayed prior to execution, users can verify consumption before starting their analysis.
▶ SateAIs™ Console: https://console.spcsft.com/
<Inquiries Regarding Release This>
Space Shift, Inc. (Attn: Motomura, Uchida, Miyata, Majima)
Inquiry E-mail: pr@spcsft.com
